The lacrosse world is currently experiencing the advent of analytics, fantasy lacrosse and sports betting. Analytics help us better understand the game and teams strengths and weaknesses.
Jake Watts is leading the analytics effort at the Premiere Lacrosse League. DraftKings and William Hill are producing odds for team victories based on their own analyses. We truly have more information accessible to us than ever before.
Today we are introducing our contribution to lacrosse analytics: the PLT Win Probability Engine v0.0.1. Our model will be available live during the PLL Championship Series games along with box score stats. Win probability models are popular in various other sports and their value has been explained very well by Ben Alamar, ESPN’s director of Sports Analytics, using the Patriots vs. Falcons super bowl game as an example.
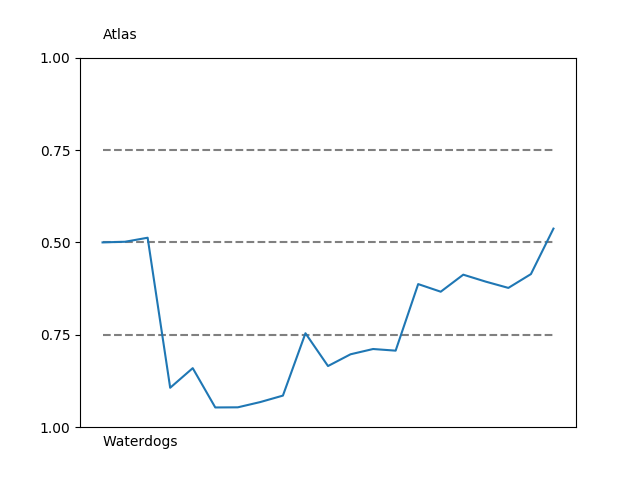
In similar fashion, let’s take a look at the contest between the Atlas and the Waterdogs from Sunday, July 26.

Our model clearly depicts the story of the game. The Waterdogs quickly gained an overwhelming advantage. Multiple times throughout the game, the Atlas would gain some momentum only for the Waterdogs to suppress it with their own runs of goals. This curve highlights the determination of the Atlas team to fight throughout the entire game after a very slow start and a subpar performance from Trevor Baptiste and the faceoff unit. The PLT Win Probability Engine did not award the advantage to the Atlas until Cloutier’s eventual game-winning goal.
In contrast to ESPN’s win probability metric for football, our model only gave the Atlas a slight advantage after their last goal even though so little time was left. Given the speed and flow of lacrosse, there are a large number of scenarios that would have allowed for the Waterdogs to respond and win or send the game into overtime. While the model gave the Atlas the presumed advantage, it also accurately shows how the Atlas narrowly escaped with this victory.
The box stats show how closely the two teams were in almost every single category:
| Goals | Assists | 2 Pt Goals | Total Scores | 2 Pt Shots | 2 Pt % | Shots | Shot % | Ground Balls | TOs | CTOs | Face off Wins | Face off Losses | Faceoff % | Man Up Goals | Man Up Opportunities | Man Up % | Saves | Save % | |
| Atlas | 11.00 | 6.00 | 0.00 | 11.00 | 7.00 | 0.00 | 34.00 | 0.32 | 26.00 | 14.00 | 6.00 | 11.00 | 14.00 | 0.44 | 0.00 | 0.00 | 0.00 | 15.00 | 0.60 |
| Waterdogs | 10.00 | 7.00 | 0.00 | 10.00 | 0.00 | 0.00 | 36.00 | 0.28 | 25.00 | 17.00 | 7.00 | 14.00 | 11.00 | 0.56 | 2.00 | 3.00 | 0.67 | 12.00 | 0.52 |
Our hope is that the PLT Win Probability Engine can enhance fans’ viewing experience, as well as allow fans to draw inferences about the outcome of games based on the data presented.
We want to thank Flow Fantasy Inc. for recording many of the stats that allow us to produce these box scores and effectively run the PLT Win Probability Engine. Data presented here and for future games is collected by Flow Fantasy Inc. and Pro Lacrosse Talk and may differ from data presented by the PLL. The PLT Win Probability Engine should not be used as a main source to make decisions about sports betting and readers are encouraged to make sure the box score is up-to-date before interpreting the data presented by the Probability Engine.
Subscribe to and rate the Pro Lacrosse Talk podcast:


